Scatter Chart
Scatter Chart component draws one marker per point, on two value axes.
It is the one chart that takes points rather than labels and values: both of its axes are value axes, so a point carries its own x. The rest of Chart applies unchanged — the conf, the palette, the notes.
API
func ScatterChart(c *tgframe.Container, series []ChartSeries, conf ...*ChartConf)
cis the parent container.seriesare the series to draw. Every series needs itsPoints, and noValues; anything else draws an error placeholder instead of the chart and fails the run, without stopping the rest of the page.confis an optional configuration, at most one.ScatterChartsetsKinditself and ignores what the conf says.
ChartPoint:
| Field | Description |
|---|---|
X | Position on x axis. |
Y | Position on y axis. |
Example
	tgcomp.ScatterChart(p.Main,
		[]tgcomp.ChartSeries{
			{Name: "runs", Points: []tgcomp.ChartPoint{
				{X: 1, Y: 3}, {X: 2, Y: 5}, {X: 3, Y: 4},
				{X: 4, Y: 8}, {X: 5, Y: 6},
			}},
		},
		&tgcomp.ChartConf{ID: "demo_scatter"})
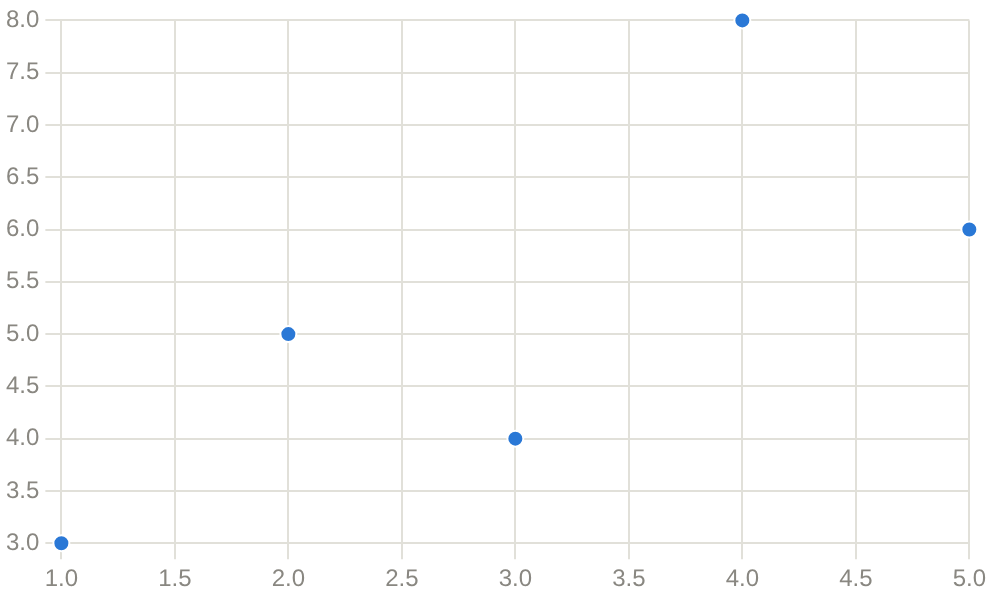
Axis titles and a height come from the conf, the same as the other kinds:
tgcomp.ScatterChart(p.Main,
	[]tgcomp.ChartSeries{{Name: "p95", Points: points}},
	&tgcomp.ChartConf{
		XLabel: "concurrency",
		YLabel: "ms",
	})
XLogScale and YLogScale put either axis on a log scale; every point's x or
y on that axis must be > 0. See Chart.